


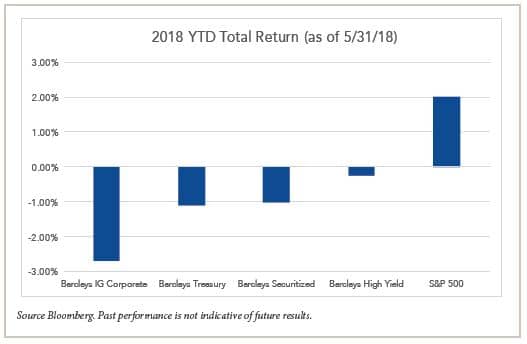
While the return of volatility in the equity market that began in February has received considerable attention, investment grade corporate debt has quietly experienced the worst performance of all major asset classes in 2018, down 2.70% through May 2018, as evidenced in the chart below. A combination of higher interest rates and wider credit spreads has resulted in the largest negative return for the first five months of a calendar year since 1996.
Finding Value in Investment Grade Corporates
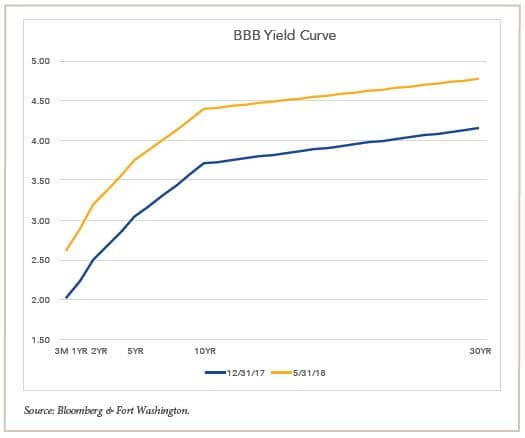
Within investment grade corporates, while long corporates (10+ year maturities) have performed the worst due to duration, intermediate corporates — defined as 5-10 year maturities —may offer the most attractive risk-adjusted return potential. Looking at the BBB Corporate yield curve, the shift up has been a parallel move, maintaining a steep yield curve in the 2- to 10-year part of the curve. This offers opportunity for return in intermediate corporates from rolling down the yield curve in addition to coupon income. The shorter duration of the intermediate part of the curve also lessens the sensitivity to higher rates and wider credit spreads resulting in an attractive risk-return tradeoff.
To highlight this view, take the example of purchasing a BBB corporate bond with 8 years to maturity, priced at 4.25% yield to maturity, +140 bps option-adjusted spread (OAS) compared to purchasing a BBB corporate bond with 30 years to maturity, priced at 5% yield to maturity, +200 bps OAS. Evaluating the return potential of these investments over a 3-year horizon, even under a bearish scenario, the combination of yield and curve roll down for the 8-year BBB bond likely cushions the negative effects of higher rates and wider credit spreads.
 As this analysis shows, over a three year horizon, the base case return of the 8-year BBB bond is nearly equal to the 30-year BBB bond — 4.81% versus 5.00%. While the 30-year bond will likely outperform in the bull case due to the longer duration, the downside protection of the 8-year bond in the bear case should still be above 3%, while the 30 year bond will likely have a negative return.
| Market Conditions | YTM of 8Y BBB Bond in 3 Years |
Annualized Total Return - 8Y BBB |
YTM of 30Y BBB Bond in 3 Years |
Annualized Total Return - 30Y |
|
|---|---|---|---|---|---|
| Bull Case | Lower Rates/Tighter Spreads | 3.10% | 5.68% | 4.30% | 8.10% |
| Base Case | Rates & Spreads Unchanged | 3.80% | 4.81% | 5.00% | 5.00% |
| Bear Case | Higher Rates/WIder Spreads | 5.20% | 3.04% | 6.40% | -0.60% |
Source: Bloomberg & Fort Washington. This is for informational purposes only, and should not be construed as investment advice. Outlook reflects subject judgments and assumptions subject to change without notice. Unexpected events may occur; there can be no assurance that developments will transpire as forecast. Past performance is not indicative of future results.
From Market Opportunity to Portfolio Action
This favorable view towards corporate bonds, especially intermediate corporate bonds, is reflected in our current positioning in the Fort Washington Active Corporate strategy. As of 5/31/2018, the portfolio is overweight risk versus the Bloomberg Barclays US Credit Index, with yield advantage of 38 bps and sector overweights to financials, autos, and communications, which should perform well in a spread rally. We view intermediate financials, specifically domestic banks and REITs, as particularly attractive. We expect banks to continue to improve their balance sheets and grow earnings due to higher rates. REITs are managing the secular shifts in retail and the effects of higher interest rates by upgrading property portfolios and terming out debt maturity schedules.
While the portfolio is currently duration neutral versus the benchmark, we are overweight risk in the short and intermediate maturity buckets from both a percent of market value and percent of spread risk.
| Maturity Bucket | Fort Washington Active Corporate % MV |
Bloomberg Barclays US Credit Index % MV |
Fort Washington Active Corporate % Spread Risk |
Bloomberg Barclays US Credit Index % Spread Risk |
|---|---|---|---|---|
| Short: 0-5 Year | 28% | 40% | 20% | 12% |
| Intermediate: 5-10 Year | 44% | 28% | 40% | 24% |
| Long: 10+ Year | 28% | 32% | 40% | 64% |
Source: Bloomberg & Fort Washington. Past performance is not indicative of future results. Portfolio characteristics subject to change at any time without notice.
Summary
As discussed in my previous blog article, for investors with longer-term horizons, active fixed income strategies such as Fort Washington’s Active Corporate, have demonstrated positive returns to the benchmark on a net of fees basis. Beyond the value added through dedicated fundamental analysis and security selection, Fort Washington’s Active Corporate strategy is able to tactically allocate to the most attractive parts of the credit yield curve. In today’s environment, we view the intermediate maturities as the best opportunity for positive returns.


