Midstream Energy Update — Buy Signals Flashing
Midstream Whac-A-Mole
Late in November of 2014, OPEC started what has become a prolonged battle for market share — a process that has been anything but predictable. OPEC compliance remains strong, Russia became and continues to be supportive of OPEC, and U.S. oil production has surged as drilling and cost efficiencies have taken hold. At the same time, domestic U.S. gas production has grown, and exports have surged.
Yet for the energy sector as a whole, and midstream in particular, equity values have crumbled. While we have remained steadfast in our investment process during these tumultuous times, we have found solace and opportunities as we examine the space through an equity lens with a credit filter. We believe this approach has helped us avoid some of the notable problems within the space, but it hasn’t helped us avoid the onslaught with the portfolio down 38.4% since November 25, 2014, and the benchmark, Alerian MLP Index (AMZ) off 40.6% (total return basis). Fort Washington’s Midstream Energy/MLP strategy outperformed the benchmark by 94.7 bps (gross) since the beginning of the battle for market share, November 25, 2014.
Over the past three and a half years, it has felt like the midstream space has been part of a game of Whac-A-Mole where every time the sector gets a reprieve and a sign of life, it is whacked down, only to rise again and repeat. The latest clobbering came from the poorly communicated FERC announcement on income tax allowances (more on that later in this document), which saw the AMZ collapse 10% within one hour, as selling begat selling, and a lack of understanding of FERC rate-making was clearly observable given the chaos that ensued. The AMZ closed down 4.8% on the day of the announcement and has since given back most of what was recovered during the hour-long sell off with the AMZ down 8.3% (as of close on April 4, 2018, relative to close on March 15, 2018). Fort Washington’s Midstream Energy/MLP strategy has outperformed by 197 bps (gross) since March 14, 2018.
While we have read many analogues about the decision and what it means for the space, we believe the real impact from the FERC announcement has been on sentiment, since we find the impact on cash flows to be negligible for most of the space. This is where we take a step back and look at valuations — not just stock vs. stock, but also across time and across sectors — and we reach out to the analyst community and retail brokers to get a pulse on the market.
What we are hearing is a mixture of both hope and fear. Retail investors, historically a large component of LPs (Limited Partnerships, most of which issue K-1s) and some C-Corps, are looking at midstream companies wondering if the high yielding C-Corps and LPs are dividend traps. On the institutional side, there is a mixed message as some generalists remain focused on anything but energy (leaving us to wonder if the momentum trade still has legs). On the other hand, we are starting to hear of increasing inbound calls as PMs and analysts take a fresh look at a beat up sector, giving a glimmer of hope to energy specialists that “new” money could be put to work.
Open the Valuation Toolkit & Valuation Is Compelling
Despite the recent volatility within the midstream space, and the risk that retail investors have been abandoning their holdings, we find the valuations for midstream companies (C-corp and LPs) are at levels we haven’t seen in years — in some cases in over a decade — while valuations for other sectors appear to be at near record levels. Dividend yields for midstream C-Corps have remained elevated, despite balance sheets improving since 2014. In an increasing number of cases, the midstream companies are focused on self-funding growth and possibly slowing the dividend increases and opting instead for share buybacks. Typically, share buybacks make us cringe, but at these prices, even we are on board.
The midstream sector, and more broadly the energy sector, has decoupled from the price of oil, which is a welcome change. Prior to the OPEC battle for market share, the long-term daily correlation between the AMZ and the front month contract for crude was 0.38 (January 1, 2010 to November 24, 2014). During the early innings of the battle for market share (2015-2016), the average correlation was over 0.5, with 2016 averaging 0.7 as the market came to terms with crude being “lower for longer” as the supply-demand imbalance remained skewed in favor of excess supply. By mid-2017, the imbalance had been resolved, and the correlation backed off to 0.48. It’s now 0.35, in-line with the pre-2015 long-term average. We believe this is important since it removes some volatility from the market (unproductive volatility in our mind) and provides the opportunity for investors to focus on the fundamentals and relative value.
When we look at the fundamentals of individual companies, we rely on our investment process, which includes a valuation toolkit, including custom cash flow models and multiple valuation methods, to triangulate a fair value estimate for a company. There is no one size fits all method for valuation, especially when our investible universe is agnostic to corporate structure and country of domicile.
Let’s take the toolkit approach and consider some data points, which reinforce our view that current midstream equity valuations should be seriously considered as buying opportunities.
Oil Fundamentals
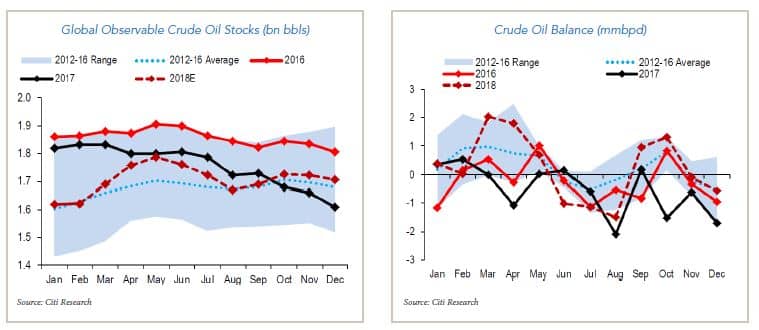
We believe the market continues to underestimate:
- OPEC compliance and thus the sustainability of production caps.
- The global decline rate for oil will accelerate due to the production cuts from two years ago which resulted in major offshore projects being delayed (these require long lead times and are key in offsetting large declines).
- Increasing risk of production outages.
- Strengthening demand for oil.
There are two data series that illustrate our view that supply and demand is in balance — these are Global Observable Crude Oil Stocks and Crude Oil Balance:
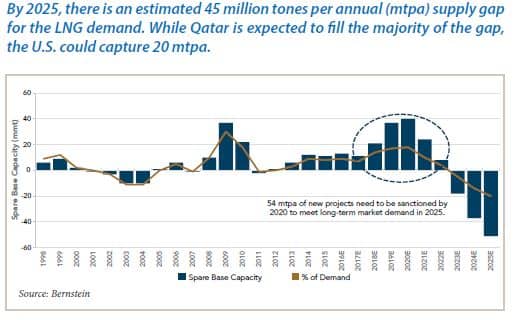
Natural Gas Fundamentals (North America Has a Long-Term Oversupply Problem)
We believe the global natural gas market is oversupplied, a view that is not atypical for analysts. This is partly a result of a misalignment between sanctioning of Liquefied Natural Gas (LNG) projects (usually with some excess capacity) and demand growth, coupled with competition from onshore pipelines, including new pipelines connecting Russian onshore natural gas with demand for natural gas in Northern China. We expect the global imbalance to tilt in favor of a need for new LNG exports by 2023, with Qatar and the U.S. expected to lead the growth in export terminals. We are highly skeptical of LNG exports off Canada’s west coast.
We continue to see regional supply-demand imbalances, largely a result of infrastructure failing to keep up with demand. This includes egress for Marcellus / Utica gas and associated gas from the Permian, Canadian gas into Ontario (Canadian gas has largely been backed out the U.S.), Chinese demand for LNG imports, and domestic production and imports from Russia.
Valuation
Looking at the fundamentals of each company and the prospects for a healthy total return, we find the weighted average 12-month potential total return for the portfolio to be in excess of 30%, inclusive of an expected 7.4% yield.
Yield Valuation
On an indicated yield basis, the Fort Washington Midstream portfolio is yielding approximately 7.4% (as of April 4, 2008). The Alerian MLP Index (AMZ) is yielding 8.8%. Broadly speaking, we look for 200 basis points of compression (relative to historic yields for the Index in addition to spread to the 10-year Treasury).
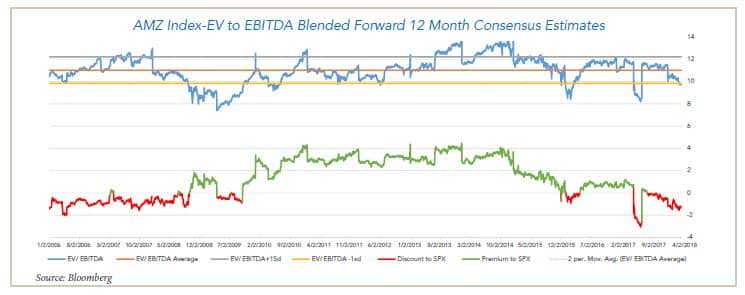
Forward Multiples
EV/EBITDA (blended forward 12 month EBITDA) midstream is trading at 9.7x (as of 4/4/2018), and we believe it should be closer to 11.0x.
The long-term average for EV/EBITDA is 11.0x. We calculate this using daily estimates since January 2, 2006, and we believe this approach is reasonable as it captures several business cycles for midstream energy. The market is currently trading just under 1 standard deviation (9.8x) below the historic average. For the first time since 2006-07, the AMZ has fallen below the S&P, for several consecutive months. We believe it should trade at a slight premium to the S&P.
 Earning Power Value (EPV)
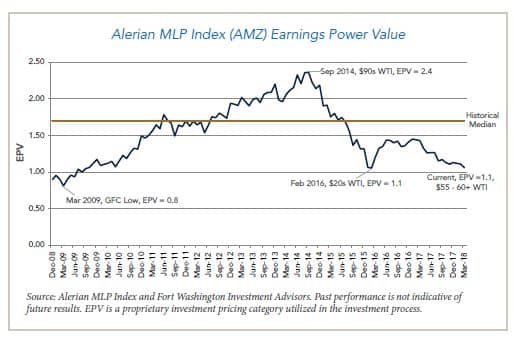
EPV represents the value of a business based on normalized current cash flows, assuming no growth of future cash flows. EPV indicates the market is pricing in close to no growth, while we look for EBITDA growth to be in the high 20%’s in 2018 and low 20%’s in 2019.
- An EPV of 1.0 indicates the market is pricing in no growth.
- The Alerian MLP Index EPV bottomed at 0.8 in the Great Financial Crisis (GFC) (2007-08) and 1.1 in early 2016 ($20s WTI).
- EPV peaked near 2.4 in 3Q 2014 ($90s WTI). The long-term historical median is roughly 1.7.
- At the current level of 1.1, we view MLPs as very undervalued with almost no growth priced-in.
FERC Announcement
The FERC¹ announcement on March 15, 2018, stated that MLP companies will no longer be able to take an income tax allowance (ITA) on interstate oil and gas pipelines. As such, FERC has provided companies several ways to respond to this.
One method is to refile the rate. Another is to do nothing and wait for FERC to commence a Section 5 rate case, which could take 12-24 months to complete. We believe these are the most likely approaches for operators.2 A refiling allows a proponent to make adjustments and additions to the rate base, including changing the share of debt/equity, including new costs/charges, and other items with the net impact being no material rate change, or in some cases higher rates.
Key Points:
- This is analogous to the approach taken by utilities when changes happen.
- FERC accounting doesn’t easily translate into GAAP accounting, making 1:1 comparisons erroneous when analysts seek to build a tolling model to extrapolate the impact on GAAP financial statements.
- For most companies that we hold with a potential impact we expect the impact to be negligible after a new rate filing is made, or perhaps corporate structure is changed.
Implications: Broad Selloff in All Midstream
Who Is Not Directly Impacted?
- C-Corps with no public LP
- MLPs with negotiated or market rate pipelines
- Non-pipeline MLP assets (intrastate pipelines, gathering & processing, LNG facilities, etc.)
Who Is Potentially Impacted & Concerns (Low Impact or Low/High Impact)?
- Public MLPs with wholly owned natural gas interstate cost-of-service pipelines with contracts coming offline
- Interstate pipelines (crude, refined products, natural gas liquids, gas) subject to FERC cost-of-service-based rates owned by MLPs
- Crude or refined products pipelines at the next FERC index reset in 2020
Where There Is Uncertainty:
- There is a lack of quantifiable numbers for the impact on gas pipelines and 2020 oil pipeline index (FERC PPI) revision.
- Many companies are already earning below cost of service on a consolidated basis—does this act as a catalyst to force that return higher?
- Remaining questions as to who is impacted (private vs. public MLP; treatment of JVs; public LPs majority owned by C-corp).
- This could accelerate conversions to C-Corp from LP.
Responding to FERC Volatility – Canada Provided a Source of Liquidity, Hong Kong Protection
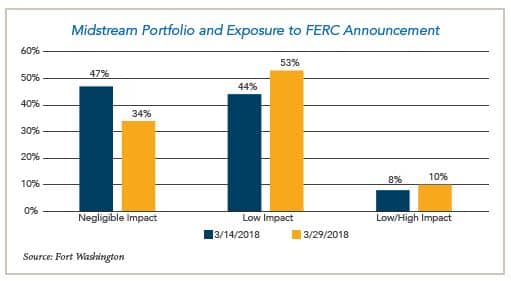
The portfolio is agnostic on corporate structure or country of domicile. We seek the best risk adjusted total return opportunity. Prior to the FERC announcement, the portfolio included two high quality Hong Kong listed midstream C-corps, four Canadian midstream C-corps, and 9 U.S. domiciled C-corps. The remaining 14 securities were LPs. On the day of the announcement and during the early turmoil, we saw a significant valuation gap open for non-U.S. and midstream companies not included in the AMZ. We sold two of our four Canadian midstream companies (one small and one mid-cap) and three U.S. listed securities (one infrastructure focused company, a general partner, and one LNG shipping company). This resulted in a rotation into one large U.S. LP with significant exposure to liquids transportation and storage and one mid-cap U.S. LP with ownership interest in several large crude oil pipelines. The chart above provides an illustration of the changes as the portfolio has shifted from a large “no impact” to FERC position to an increased weight in the negligible impact and a slightly larger weight in the low/high impact category.
Summary
In summary, we believe now may be an ideal time for investors to get back into the midstream space. Valuations are extremely attractive, and in some instances we haven’t seen levels this compelling in years. While we recognize that the recent noise from FERC could keep some investors on the sidelines, we believe such an approach would be in error. The FERC announcement remains a proposal, and we believe there are lots of avenues for companies to mitigate and/or eliminate the relatively minor risk from the announcement.
1 FERC is Federal Energy Regulatory Commission.
2 Dominion Midstream has filed a request for clarification or rehearing and expedited action request seeks FERC to clarify the recent policy change, calling it unjust as applied to an MLP that is owned by a C-Corp which has the same tax liability as if the pipeline was a C-Corp Past performance is not indicative of future results. Estimating the percent of EBITDA that could be impacted by the FERC announcement is extremely challenging. For this reason we have elected to group those with potential impacts and concerns as either a low impact event (discussions with management and our analysis lead us to believe this is a very low single digit potential percentage impact on EBITDA), or a low/high impact (these are companies with an impact that should be higher than the low case but still likely less than a 10% impact on EBITDA and we believe it that estimate is extreme and highly unlikely).