- The Treasury bond market has come under scrutiny as the 10-year yield pierced 3% last week, while the yield curve has flattened considerably over the past year. Market participants are pondering what’s behind these moves and whether they are likely to continue.
- Most of the rise in the 10-year yield this year reflects an increase in the real (inflation-adjusted) yield in response to an anticipated pick-up in economic growth and Fed tightening. There has also been a modest rise in inflation expectations, and the recent surge in oil prices contributed to the latest uptick.
- We do not foresee a further large increase in intermediate and long-date Treasury yields, as inflation is unlikely to surge. However, the Fed is expected to continue to raise the funds rate gradually from the current range of 1.5%-1.75%. If it were to reach 2.75%-3.0% by next year, the yield curve could become flat or inverted.
- While yield curve inversions have been fairly reliable indicators of recessions in periods of high inflation, the current economic growth outlook suggests that these worries are premature. Also, inflation remains low by historical standards and there are no indications of stress in credit markets.
Rise in Treasury Yields
The yield on the 10-year Treasury has risen by nearly 60 basis points this year, and it topped the 3% level last week for the first time since mid-2014. In our commentary for the first quarter (see April 6th blog), we showed that most of the rise in yields is associated with an increase in real yields, as measured by the yield for Treasury Inflation Protected Securities (TIPS). This occurred amid expectations that the pace of economic activity would accelerate to 2.5%-3.0% in large part due to the stimulus coming from tax legislation that was enacted at the end of 2017.
Treasury yields paused in March in response to indications that first quarter GDP growth would come in around 2%. However, market participants subsequently have shrugged this off as a seasonal aberration. (Note: Throughout the expansion the pattern has been that first quarter GDP post sub-par growth but is then followed by stronger growth over the remaining quarters.) Indeed, most indicators point to an acceleration of growth.
Some of the rise in bond yields has also been associated with a modest rise in core inflation (which excludes volatile food and energy components) and inflation expectations. The closely watched measure of inflation by the Fed, the Core PCE price index, has risen to just below 2%, nearly in line with the Fed’s target. An additional important development of late which should support inflation at these higher levels is a firming in oil prices amid reports that OPEC is striving to keep its benchmark price at or above $70 a barrel.
Flattening of the Treasury Yield Curve
While there has been a significant rise in intermediate Treasury yields this year, the yield curve as measured by maturities of two to ten years has flattened considerably since early 2017 (Figure 1). The principal factor is the ongoing tightening of monetary policy by the Federal Reserve, which has seen the Fed funds rate rise by 100 basis points to the current range of 1.50%-1.75%. Looking ahead, the Fed has signaled that it is contemplating raising the funds rate two or three more times this year following the increase that took place at the March FOMC meeting. And the so-called “dots” suggest the Fed could make additional moves next year that could take the funds rate in the vicinity of 3%.
Figure 1: Treasury Yield Curve Has Flattened, 2017 through April 2018
(10 year minus 2 year yield)
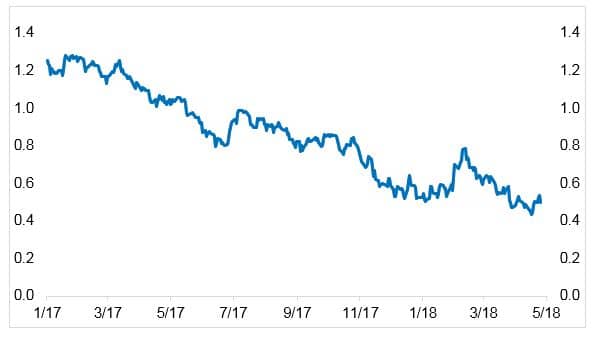 Source: Bloomberg.
Amid this, there have been numerous commentaries recently discussing why the curve has flattened and what it portends. There is widespread agreement that the curve typically flattens late in the economic cycle when the Federal Reserve is tightening policy. Also, yield curve inversions are among the best indicators of recessions (Figure 2). The explanation is that as short rates rise and bond yields decline, market participants are signaling the economy is about to weaken.
Figure 2: Yield Curve Inversions Typically Precede Recessions
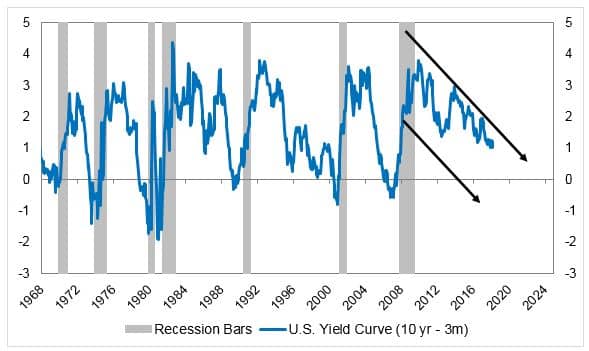
Source: Cornerstone Macro, Bloomberg.
Where Is the Curve Headed?
Considering that Fed tightening is the key determinant of a flatter curve, market commentators are now ruminating about whether the curve is about to go flat or invert later this year or next year. This is a possibility if the Fed eventually increased the funds rate in the vicinity of 3%.
The caveat, however, is the Fed does not set policy rates in a vacuum: A lot hinges on how the economy and inflation fare. The upside risks to Fed tightening, for example, would occur either if core inflation were to accelerate beyond the Fed’s 2% target and/or the unemployment rate were to decline materially below 4%. Alternatively, the Fed would likely pause if the economy and labor market softened. One indicator of this would be a rise in the trend of weekly jobless claims.
Meanwhile, Fed officials will be discussing what the “neutral” funds rate is in their deliberations. It is defined as the level at which the funds rate is neither accelerating nor restraining the economy. Among the leading researchers on this issue are John Williams, president of the San Francisco Fed who has recently been announced as the next president of the NY Fed, and Professor Richard Clarida, who has been announced as the next Federal Reserve Vice Chairman of the Board of Governors.
Along with Fed chair Jerome Powell, Williams and Clarida will form the new “troika” that will drive U.S. monetary policy. Their research suggests the neutral funds rate is considerably lower than it was before the 2008 Global Financial Crisis: It is estimated to be in the vicinity of 2% today versus 4% previously. If so, U.S. monetary policy will be operating in neutral territory by the end of this year, and subsequent rate increases could tend to slow the economy. Therefore, Fed policymakers could pause as the rate moves beyond 2% to see how the economy is faring before taking additional action.
Recession Watch Is Premature
One issue investors are considering is whether the flattening yield curve is signaling a slowing of the economy. We believe it is not, as the impact of the fiscal stimulus resulting from the tax cuts enacted in December and the spending increases that were passed in March has yet to play out. Also, while these fiscal policy actions should give the economy a temporary boost, it is too early to judge the ongoing effect.
One of the main objectives of corporate tax reform was to expand business capital spending and thereby to increase productivity. Two encouraging signs are that business confidence has soared since the presidential election and business investment, which has lagged throughout the expansion, has picked up over the last year. However, because the experience with comprehensive tax reform is limited, there are no hard and fast rules to use to assess the long-term consequences.
Finally, as the economy approaches the ninth year of the current expansion – making it the second longest on record – it is natural for investors to be on the lookout for signs of recession. That said, business cycles do not end because their age is a factor. Rather, they typically end either when imbalances in the economy lead to shortages and inflation or when credit market conditions tighten abruptly. With no sign of either of these factors, we believe the risk of recession is low now, but conditions could change in the next year or two.