- Recent stock market gyrations have caused investors to reassess the underpinnings of the market’s steady rise since the 2016 elections. Foremost on peoples’ minds is whether the period of unusually low interest rates is over. We believe it is, but the path to higher interest rates is likely to be irregular.
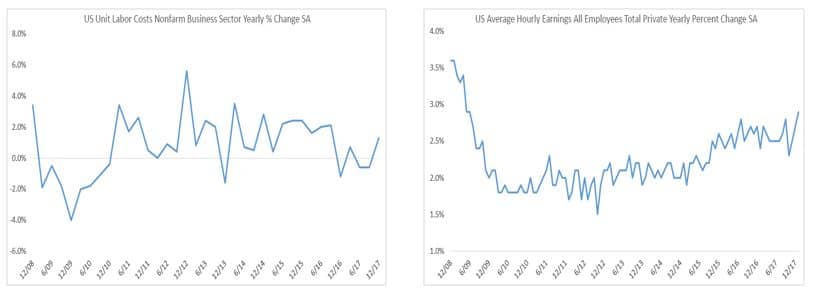
- The catalyst was a stronger-than-expected-wage increase in the January jobs report, which led some observers to wonder whether it portends higher inflation and additional Fed tightening. The evidence is mixed, as wages have been rising gradually but unit labor costs have been stable.
- The key driver of bond yields most likely is higher real interest rates. The reason: Economic growth and capital spending are accelerating when the federal budget deficit is about to balloon. This pattern is reminiscent of the Reagan years, when the U.S. experienced record budget and current account deficits and high real interest rates.
- The bottom line is a mix of forces is weighing on financial markets now. While a bear market in equities is unlikely as long as the economy and profits are strong, investors should be prepared for protracted volatility.
Return to Normalcy Spells Higher Volatility
Amid the turmoil in the stock market in recent weeks, many people are wondering what’s wrong with the market. My response is nothing. What was abnormal was the prolonged period of market calm last year, when the stock market advanced steadily without a pullback of as much as 3%. The market, in fact, went 499 days without a correction of 10% or more. On top of this, investor sentiment turned euphoric late last year as comprehensive tax legislation was passed in the U.S. while economic readings pointed to accelerating growth. Meanwhile, stock market volatility as measured by the VIX fell to record lows (Figure 1), which left the market vulnerable for surprise developments.
The catalyst for the sell-off was the January jobs report, which showed average hourly earnings rising to 2.9% from 2.5%. This heightened concerns that wage and price pressures could be increasing, and it focused attention on the possibility the Federal Reserve could tighten monetary policy more than had been priced into the bond market.
With the yield on the 10-year treasury having risen about 40 basis points since the tax legislation was passed in mid-December, investors are unsure how much higher yields could rise and what effect it would have on the stock market. Nonetheless, while conditions are in flux, it is increasingly evident that the period of unusually low bond yields since the 2008 financial crisis is coming to an end.
Figure 1: Equity Market Sentiment: Extremely Bullish
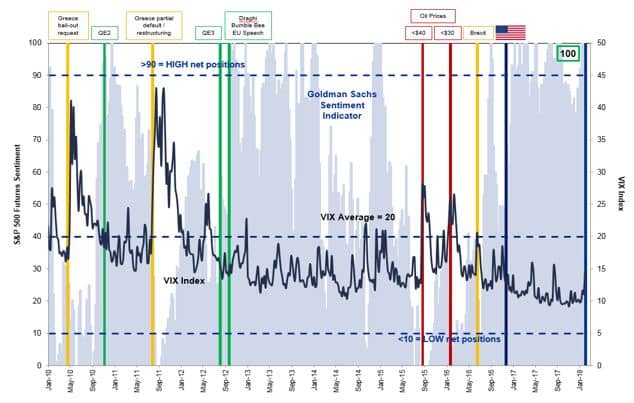
Source: Goldman Sachs. For informational purposes only.
The Case for Higher Bond Yields
There are several reasons for expecting bond yields to rise materially in the next year or two. One is that the economy may be approaching full employment, in which case wage and price pressures could ensue. Another reason is that real bond yields (which exclude inflation expectations) have begun to rise since passage of the tax bill. A third consideration is that the U.S. trade deficit is also poised to increase, and it may become more difficult for the U.S. to attract financing from abroad on favorable terms.
Of these factors, we foresee a gradual rise in inflation or inflation expectations as the economy approaches full employment, rather than a spike. For example, the data are mixed when looking at wages and unit labor costs. Figure 2 shows that average hourly earnings have increased gradually over the past two years; however, unit labor costs, which take into account labor productivity, have held relatively steady. In short, the increase in wages has been offset by improvements in output per man-hour. While some commentators believe core inflation is likely to accelerate in the next few months, few foresee it rising materially above the Fed’s target of 2%.
Figure 2: Average Hourly Earnings & Unit Labor Costs
 By comparison, we have greater conviction that real interest rates, which have surged in recent weeks (Figure 3), are likely to continue rising in the next couple of years. One reason is that economic growth has been running at a 3% rate in recent quarters, which is above the economy’s long-term potential of 2%-2.5%. Moreover, business capital spending, which had been a laggard throughout the economic expansion, has begun to accelerate, and it is poised to grow above-trend now that comprehensive tax reform has been enacted.
Figure 3: Real Yields Have Risen Recently
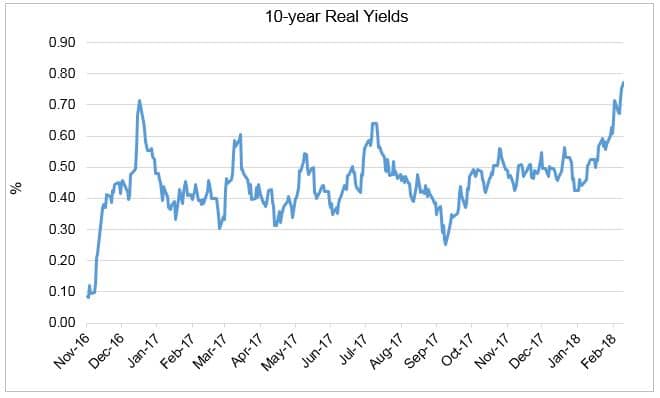
Source: U.S. Treasury.
These developments are taking place when the prospects for the federal budget have changed materially since December. First, the tax legislation that was enacted is expected to add one trillion dollars to the budget deficit over the next ten years, and much of the deficit spending is front-end loaded into the current year. Second, the spending bill that Congressional Republicans and Democrats agreed to last week to keep the federal government funded is expected to add another $400 billion to the deficit in the next two years. As a result, the Center for a Responsible Federal Budget now estimates the federal deficit in fiscal 2019 will reach 5% of GDP. This not only is well above what the Congressional Budget Office was projecting, but it could worsen the long-term outlook by an additional $2 trillion if the policies in the budget deal are extended into the future (Figure 4). In these circumstances, businesses that are seeking to expand capital spending could find themselves “crowded out” by federal borrowing in the capital markets.
The worsening outlook for the budget deficit also has ramifications for the trade deficit because of the linkage between the national income accounts.1 Indeed, this situation is reminiscent of what happened during the Reagan years, when the U.S. ran record budget and current account deficits. In order to attract the necessary capital inflows from abroad, the U.S. had to maintain high real interest rates. The same appears to be the case today. In fact, the dollar has weakened on a trade-weighted basis over the past year, even though interest rate differentials have widened in favor of the dollar. Refer to blog post from January 1st.
Figure 4: The Federal Budget Deficit: Near-Term Prospects Have Worsened Significantly
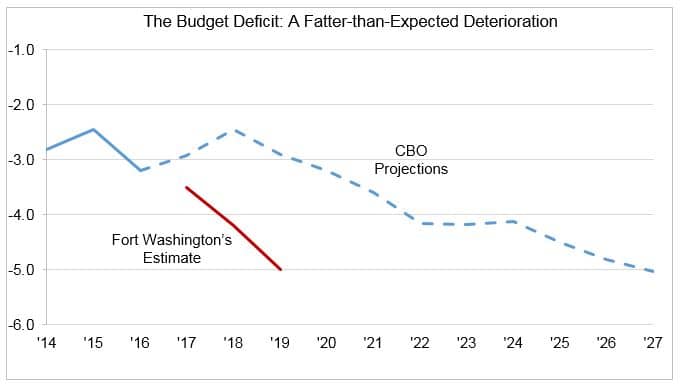
Source: Congressional Budget Office.
Implications for the U.S. Stock Market
Each of the above three forces are at play now, and they have different implications for the U.S. stock market. Insofar as the rise in bond yields mirrors higher real interest rates, the outlook for the stock market would be mixed. The reason: A stronger economy is likely to be accompanied by strong corporate profits, which should bolster the stock market. However, higher bond yields would imply a higher discount rate and somewhat lower valuations, which is what has been happening. This is the primary reason we view the recent sell-off as part of a correction, in which the market could fall by 10%-20% from its peak, rather than the beginning of a bear market, in which it declines cumulatively by more than 20%.
Should inflation become an issue at some point, the potential sell-off would be greater, because it would not boost corporate profits in real terms, but could cause investors to raise the risk premiums they use to discount future cash flows. Indeed, one of the lessons learned during the high inflation period of the 1970s was that equities were not a good inflation hedge. That said, however, we do not foresee core inflation rising materially above the Fed’s 2% threshold in the next year or two. (Note: The trigger for significantly lower stock market valuations has occurred when the inflation rate breeches 4 %.)
The worst outcome for the stock market in our view would occur if the Trump administration were to increase its trade rhetoric in the face of a widening U.S. trade deficit. The reason is that it could invite retaliation that would jeopardize the global expansion and add to the risk premium foreign investors would require to hold dollar assets. Indeed, there is some evidence that foreign investors’ appetite for dollar-denominated assets may be waning.
Our bottom line is that investors should be prepared for heightened volatility to continue for the next couple of years. While the most likely scenario is a stock market correction rather than a bear market, there is risk that policy mistakes could turn a pullback into a bear market.
1 The trade balance is equal to the sum of a budget imbalance and a saving-investment imbalance in the private sector. Note that both of these components are likely to rise in the next few years.